『ゼロから作るDeep Learning』4章続き。
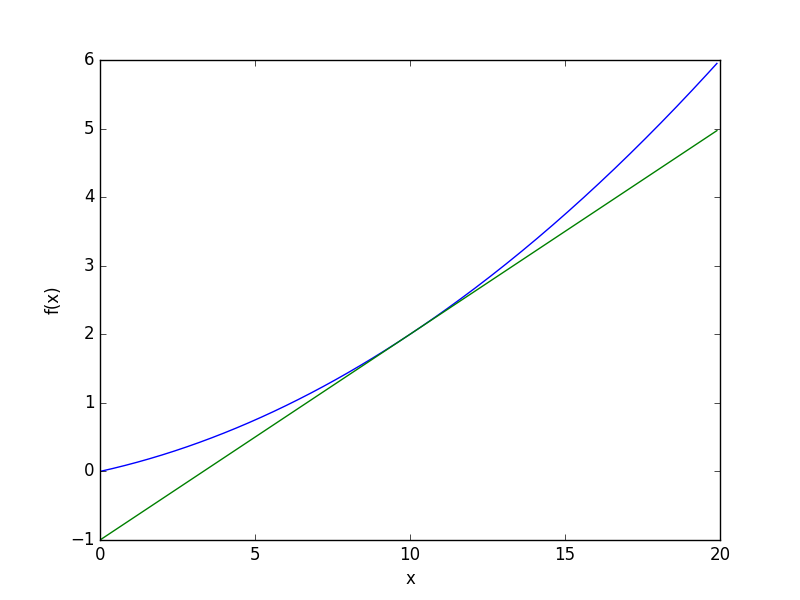
微分とは:ある瞬間の変化量
数値微分numerical differentiationとは:微小な差分によって微分を求めること
def numerical_diff(f, x):
  h = 1e-4 #0.0001程度の値が適当な微小値
  return ( f(x+h) - f(x-h) ) / (2*h)
サンプルコードを改変してグラフを生成してみる
# cat gradient_1d_save.py
# coding: utf-8
import numpy as np
import matplotlib.pylab as plt
plt.switch_backend('agg')


def numerical_diff(f, x):
    h = 1e-4 # 0.0001
    return (f(x+h) - f(x-h)) / (2*h)


def function_1(x):
    return 0.01*x**2 + 0.1*x


def tangent_line(f, x):
    d = numerical_diff(f, x)
    print(d)
    y = f(x) - d*x
    return lambda t: d*t + y

x = np.arange(0.0, 20.0, 0.1)
y = function_1(x)
plt.xlabel("x")
plt.ylabel("f(x)")

tf = tangent_line(function_1, 5) # 5->10に変更すれば2つ目の画像になる
y2 = tf(x)

plt.plot(x, y)
plt.plot(x, y2)
plt.savefig('gradient_1d.png')


続いて、偏微分
x0, x1の2変数関数の定義とグラフを表示
def function_2(x):
  return x[0]**2 + x[1]**2

# 3Dグラフを描画
# cat multivariate_func_save.py
# coding: utf-8
import numpy as np
import matplotlib.pylab as plt
plt.switch_backend('agg')
from mpl_toolkits.mplot3d import Axes3D

x = np.meshgrid(np.arange(-3, 3, 0.1), np.arange(-3, 3, 0.1))
z = x[0]**2 + x[1]**2

fig = plt.figure()
ax = Axes3D(fig)
ax.plot_wireframe(x[0], x[1], z)

plt.xlim(-3.5, 3.5)
plt.ylim(-4.5, 4.5)
plt.xlabel("x0")
plt.ylabel("x1")
plt.savefig('multivariate_func.png')

ところで、Pythonで微分コマンドなどあるのだろうか、と調査するとSympyで数学できるらしいので、さっそく導入
# conda install -c anaconda sympy=1.0
# py
>>> from sympy import *
>>> var('x')
x
>>> diff(sin(x),x)
cos(x)
こちらがドキュメント
Welcome to SymPy’s documentation! — SymPy 1.0 documentation
さて、続いて、勾配。
勾配gradientとは:すべての変数の偏微分をベクトルとしてまとめたもの
# f(x0, x1) = x0**2 + x1**2の勾配図を描くサンプルコード実行

# cat gradient_2d_save.py

# coding: utf-8
# cf.http://d.hatena.ne.jp/white_wheels/20100327/p3
import numpy as np
import matplotlib.pylab as plt
plt.switch_backend('agg')
from mpl_toolkits.mplot3d import Axes3D


def _numerical_gradient_no_batch(f, x):
    h = 1e-4 # 0.0001
    grad = np.zeros_like(x)

    for idx in range(x.size):
        tmp_val = x[idx]
        x[idx] = float(tmp_val) + h
        fxh1 = f(x) # f(x+h)

        x[idx] = tmp_val - h
        fxh2 = f(x) # f(x-h)
        grad[idx] = (fxh1 - fxh2) / (2*h)

        x[idx] = tmp_val # 値を元に戻す

    return grad


def numerical_gradient(f, X):
    if X.ndim == 1:
        return _numerical_gradient_no_batch(f, X)
    else:
        grad = np.zeros_like(X)

        for idx, x in enumerate(X):
            grad[idx] = _numerical_gradient_no_batch(f, x)

        return grad


def function_2(x):
    if x.ndim == 1:
        return np.sum(x**2)
    else:
        return np.sum(x**2, axis=1)


def tangent_line(f, x):
    d = numerical_gradient(f, x)
    print(d)
    y = f(x) - d*x
    return lambda t: d*t + y

if __name__ == '__main__':
    x0 = np.arange(-2, 2.5, 0.25)
    x1 = np.arange(-2, 2.5, 0.25)
    X, Y = np.meshgrid(x0, x1)

    X = X.flatten()
    Y = Y.flatten()

    grad = numerical_gradient(function_2, np.array([X, Y]) )

    plt.figure()
    plt.quiver(X, Y, -grad[0], -grad[1],  angles="xy",color="#666666")#,headwidth=10,scale=40,color="#444444")
    plt.xlim([-2, 2])
    plt.ylim([-2, 2])
    plt.xlabel('x0')
    plt.ylabel('x1')
    plt.grid()
    plt.legend()
    plt.draw()
    #plt.show()
    plt.savefig('gradient_2d.png')
 確かに3Dグラフの谷に向かってベクトルが向いている
次に、勾配法。
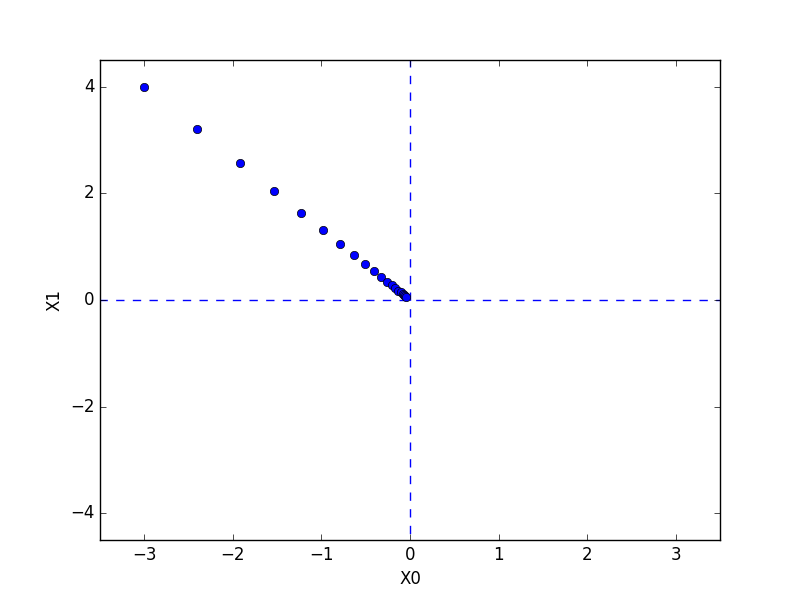
勾配法gradient methodとは:現在の場所から勾配方向に一定距離だけ進み、移動先でも同様に繰り返し勾配方向へ移動することで関数の値を徐々に減らす方法
勾配降下法gradient descent methodとは:最小値を探す勾配法で、ニューラルネットワークの分野で使われる
学習率learning rateとは:一回の学習でどれだけ学習しパラメータを更新するのかを決める割合。大きすぎても小さすぎても最適化できないので調整・確認が必要。
ハイパーパラメータhyperparameterとは:学習率のように、ニューラルネットワークのパラメータとは性質の異なる人為設定するパラメータ。
以下勾配法で最小値を探索するサンプルコード
# cat gradient_method_save.py
# coding: utf-8
import numpy as np
import matplotlib.pylab as plt
plt.switch_backend('agg')
from gradient_2d import numerical_gradient


def gradient_descent(f, init_x, lr=0.01, step_num=100):
    x = init_x
    x_history = []

    for i in range(step_num):
        x_history.append( x.copy() )

        grad = numerical_gradient(f, x)
        x -= lr * grad

    return x, np.array(x_history)


def function_2(x):
    return x[0]**2 + x[1]**2

init_x = np.array([-3.0, 4.0])

lr = 0.1
step_num = 20
x, x_history = gradient_descent(function_2, init_x, lr=lr, step_num=step_num)

plt.plot( [-5, 5], [0,0], '--b')
plt.plot( [0,0], [-5, 5], '--b')
plt.plot(x_history[:,0], x_history[:,1], 'o')

plt.xlim(-3.5, 3.5)
plt.ylim(-4.5, 4.5)
plt.xlabel("X0")
plt.ylabel("X1")
#plt.show()
plt.savefig('gradient_method.png')

最後にニューラルネットワークの勾配を求めるサンプルコード
# coding: utf-8
import sys, os
sys.path.append(os.pardir)  # 親ディレクトリのファイルをインポートするための設定
import numpy as np
from common.functions import softmax, cross_entropy_error
from common.gradient import numerical_gradient


class simpleNet:
    def __init__(self):
        self.W = np.random.rand(2,3)

    def predict(self, x):
        return np.dot(x, self.W)

    def loss(self, x, t):
        z = self.predict(x)
        y = softmax(z)
        loss = cross_entropy_error(y, t)

        return loss

x = np.random.rand(2)
t = np.array([0,0,1])

net = simpleNet()

f = lambda w: net.loss(x, t)
dW = numerical_gradient(f, net.W)

print(dW)