概要
JupyterNotebookは、セル単位でプログラムを実行できるインターフェイスがあります。
ただ、変数の値を少し変更したり、
設定条件を変えたい場合は、
セルの中身のプログラムを変更する必要があります。
もう少し、マウス操作や、直感的に数値変更できるようにするためには、
対話的インターフェイスipywidgetsエクステンションを導入することで、
Webフォームのように、インタラクティブなウィジェットを導入することができます。
導入
インストール(conda)
conda環境がある場合、
以下のコマンドラインでipywidgetsを導入できます。
$ conda --version
conda 4.6.4

$ conda install -c conda-forge ipywidgets==6.0.0
インストール(pip)
pipの場合、jupyterコマンドでextensionを有効化します。
$ pip --version
pip 18.1

$ pip install ipywidgets
$ jupyter nbextension enable --py widgetsnbextension
使用例
引数に整数値を与えてスライダを実装
引数に整数値を与えてスライダを表示する例です。
from ipywidgets import interact

@interact(i=1)
def f(i):
  return i*1024
さまざまなインターフェイス
スライダー以外に、テキストフォームやセレクトボックスやチェックボックスの事例です
@interact(i=1, f=0.1, s='text', l=['a','b'], is_checked=True)
def f(i, f, s, l, is_checked):
  return i, f, s, l, is_checked
住宅ローンの返済シミュレータ
明示的にクラス指定することで、スライダを呼び出すこともできます。
以下の事例は、住宅ローンの返済シミュレータです。
from ipywidgets import IntSlider, FloatSlider
import numpy as np

rate_slider = FloatSlider(min=1, max=5, step=0.1, value=2, description='金利')
nper_slider = IntSlider(min=1, max=35, step=1, value=20, description='返済期間')
pv_slider = IntSlider(
  min=5000000,
  max=50000000,
  step=1000000,
  value=20000000,
  description='返済金額')

@interact(rate=rate_slider, nper=nper_slider, pv=pv_slider)
def pmt(rate, nper, pv):
  rate = rate * 0.01 / 12
  nper = nper * 12
  payment = abs(int(np.pmt(rate, nper, pv)))
  print('月々の返済額: {:,d} 円'.format(payment))
  print('返済総額: {:,d} 円'.format(payment * nper))
ボタン押下時処理(イベントハンドリング)
ボタンウィジェット操作時の動作を設定する方法です。
from ipywidgets import Button
from IPython.display import display, clear_output
from datetime import datetime

def on_button_clicked(b):
  clear_output() # すでにある出力を削除
  print('{:%H時%M分%S秒}です'.format(datetime.now()))

b = Button(description='いま何時?')
b.on_click(on_button_clicked)
display(b)
使用可能なウィジェット一覧
以下コマンドでウィジェット一覧を確認できます。
from ipywidgets import Widget
from pprint import pprint

pprint(Widget.widget_types)
以下に実例が列挙されています。
https://ipywidgets.readthedocs.io/en/stable/examples/Widget%20List.html
ウィジェットのレイアウト変更
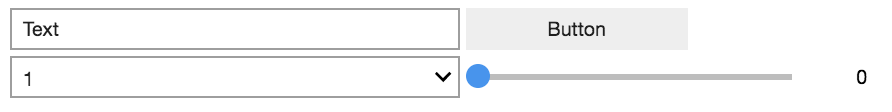
ウィジェットのレイアウトを変えたい場合は、以下設定で変更できます。
from ipywidgets import HBox, VBox, Text, Dropdown

# HBox: 横並びに整列
# VBox: タテ並びに整列
# Accordion: アコーディオン表示
# Tabs: タブ表示

w1 = Text(value='Text')
w2 = Button(description='Button')
w3 = Dropdown(options=['1', '2'])
w4 = IntSlider()

VBox([ HBox([w1, w2]), HBox([w3, w4]) ])
可視化ツールとの連携
Matplotlibとの連携
ipywidgetsとMatplotlibなどの可視化ツールを連携する方法があり、
以下のようにドロップダウンで選択した値から棒グラフを出力する方法があります。
import os
import pandas as pd
import matplotlib.pyplot as plt

anime_genre_top10_csv = os.path.join('./anime_genre_top10.csv')
top10_df = pd.read_csv(anime_genre_top10_csv)

def plot_genre_members(b):
  clear_output()
  filter_by_type = top10_df.loc[top10_df['type'] == types.value]
  plot_data = filter_by_type.groupby('genre').sum()['members']
  ax = plot_data.plot.bar()
  ax.set_title(types.value)
  plt.show()

types = Dropdown(options=list(top10_df['type'].unique()))
submit_button = Button(description='グラフを表示')
submit_button.on_click(plot_genre_members)

HBox([types, submit_button])
Bokehとの連携
インタラクティブに操作できるBokehとも連携できます。
以下、連携したデータのプロットを表示/非表示切り替えたり、
画面上で操作できるようになります。
from bokeh.plotting import figure
from bokeh.io import output_notebook, push_notebook, show
from bokeh.palettes import d3
from IPython.display import display
from ipywidgets import ColorPicker, Checkbox, Tab

# 散布図を描画
def plot_scatter(_type):
    data = df.loc[df["type"] == _type, ["members", "rating"]]
    return p.circle(
        data["members"],
        data["rating"],
        legend=_type,
        color=colors[_type],
        line_color=None,
    )


# 図形の色を変更
def change_color(change):
    if change["new"]:
        description = change["owner"].description
        _type = description.split()[0]
        r[_type].glyph.fill_color = change["new"]
        push_notebook(handle=t)


# 図形の不透明度を変更
def change_alpha(change):
    if change["new"]:
        description = change["owner"].description
        _type = description.split()[0]
        r[_type].glyph.fill_alpha = change["new"]
        push_notebook(handle=t)


# 図形の表示 ・ 非表示の切り替え
def change_visible(change):
    description = change["owner"].description
    _type = description.split()[0]
    r[_type].visible = change["new"]
    push_notebook(handle=t)


# サンプルデータの取得
df = pd.read_csv(os.path.join("./anime_master.csv"))
types = sorted(set(df["type"]))  # ユニークなtype列
colors = dict(zip(types, d3["Category10"][6]))  # 配色
# グラフの描画
p = figure(plot_width=400, plot_height=400)
r = dict(zip(types, [plot_scatter(x) for x in types]))
p.legend.location = "bottom_right"
# カラーピッカ
color_picker = [ColorPicker(description=" ".join((x, "color:"))) for x in types]
# フロートスライダ
float_slider = [
    FloatSlider(description=" ".join((x, "alpha:")), min=0, max=1, value=1)
    for x in types
]
# チェックボックス
check_box = [Checkbox(description=" ".join((x, "visible:")), value=True) for x in types]
# イベントのハンドリング
for i, x in enumerate(types):
    color_picker[i].observe(change_color, names="value")
    float_slider[i].observe(change_alpha, names="value")
    check_box[i].observe(change_visible, names="value")
titles = dict(zip(range(len(types)), types))  # タブのタイトル
# タブに登録するウィジェット
children = [
    HBox([cp, fs, cb]) for cp, fs, cb in zip(color_picker, float_slider, check_box)
]
display(Tab(children=children, _titles=titles))
output_notebook()
t = show(p, notebook_handle=True)
以上、
JupyterNotebookで対話的インターフェイスipywidgetsを使う方法でした。